A Scala library for Command Line Interface Visualizations inspired by Julia Plots.
cliviz cross compiles to Scala.js, JVM, and Scala Native, so you can try the demo directly in the browser.
Features:
-
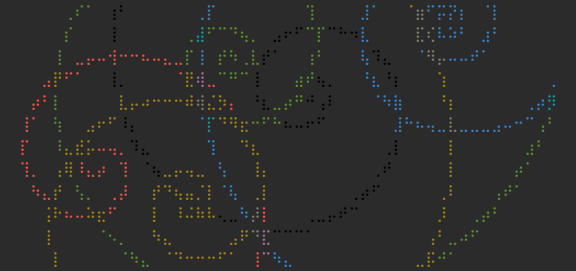
Editable Command Line Image class:
CLImgThis example features randomly generated and randomly colored spirals rendered to the command line output:
-
Time Series Plots:
-
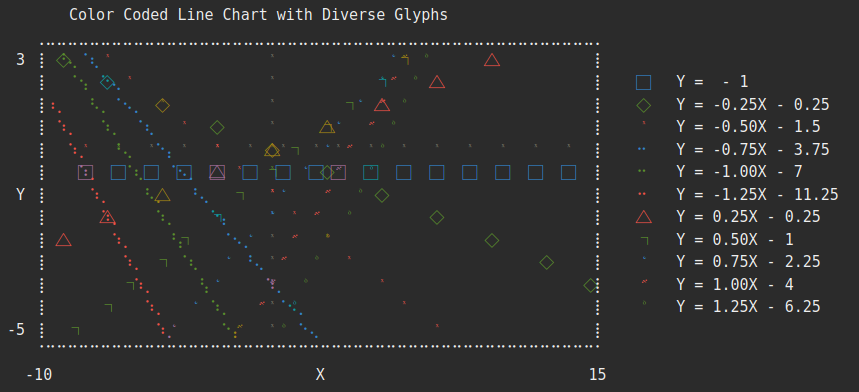
Line Plots:
-
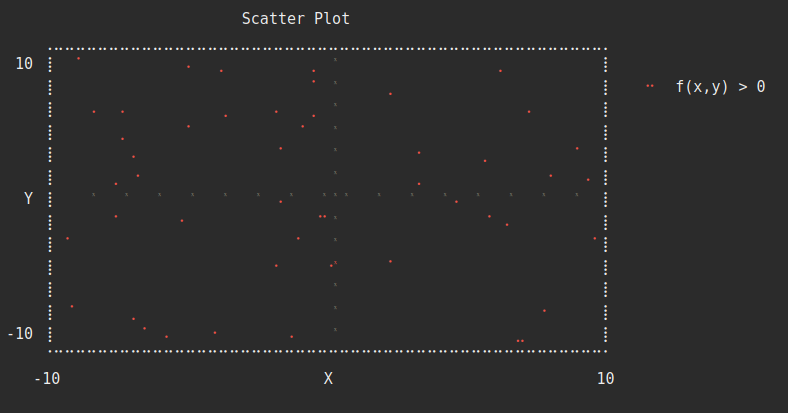
Scatter Plots:
-
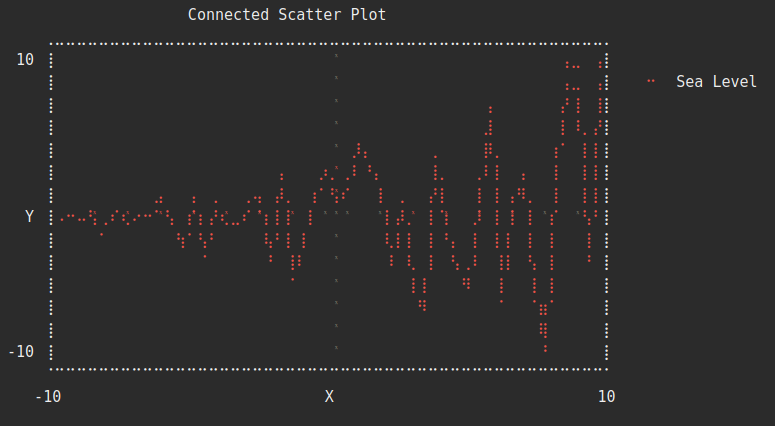
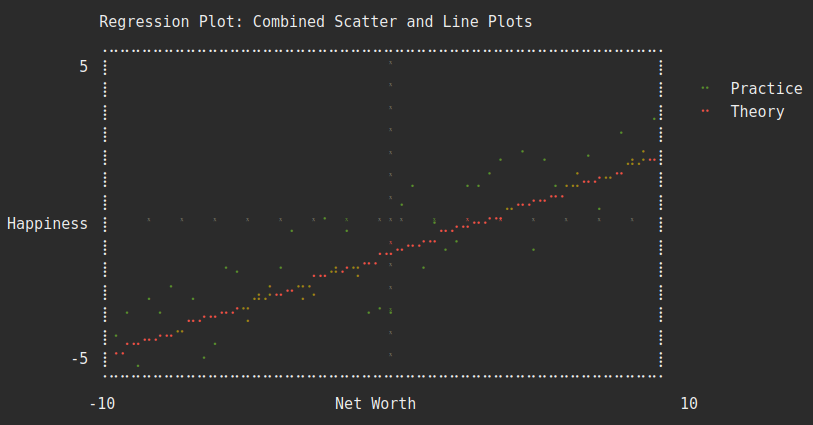
Combined Pots (Scatter and line):
-
Histogram plots:
[-17.00,-11.00 ) 🌑 ︙    ∝ 3.0E-4
[-11.00, -5.00 ) 🌑 ▕█   ∝ 0.0094
[ -5.00,  1.00 ) 🌑 ▕████████    ∝ 0.0732
[  1.00,  7.00 ) 🌒 ▕███████████████████████████    ∝ 0.2447
[  7.00, 13.00 ) 🌓 ▕███████████████████████████████████████   ∝ 0.3516
[ 13.00, 19.00 ) 🌔 ▕██████████████████████████▋   ∝ 0.2411`
[ 19.00, 25.00 ) 🌔 ▕███████▌   ∝ 0.069
[ 25.00, 31.00 ) 🌔 ▕█   ∝ 0.0101
[ 31.00, 37.00 ) 🌔 ︙    ∝ 5.0E-4
[ 37.00, 43.00 ] 🌕 ︰    ∝ 1.0E-4
The phases of the moon represent the cumulative distribution, while the labels on the left make use of standard mathematical interval notation:
()for open intervals,[]for closed intervals, and[)for intervals closed at the low end and open at the high end.
To use this library with SBT:
libraryDependencies += "ai.dragonfly" %%% "cliviz" % "<LATEST_VERSION>"See a live demo here: https://dragonfly-ai.github.io/cliviz/